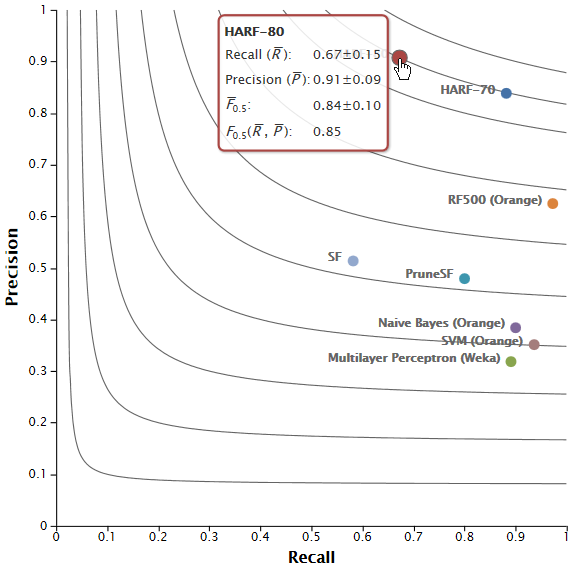
Visual performance evaluation: compare the performance of your information retrieval, entity recognition or detection algorithms in the Precision-Recall or ROC space. More »
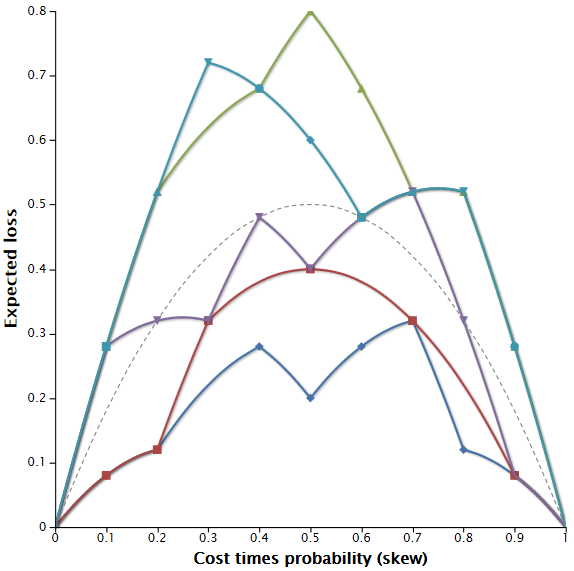
Easily chart the performance of your binary classifier systems. Included performance visualizations for PR curves, Lift curves, ROC curves, Cost curves, Rate-driven curves and Kendall curves. More »
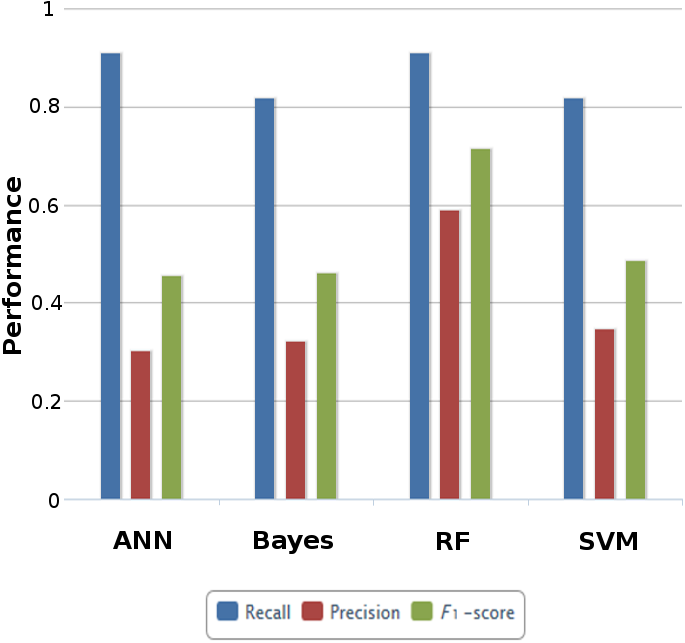
Standard graphical presentation of algorithm performance. Vizualizes the values of one or more performance measures on the evaluated algorithms. More »
 ViperCharts